Product data maturity by vertical
From the Inriver Product Data Paradox report series
No industry leads on more than one product data dimension. Find your vertical's profile.
Read the full Product Data Paradox reportNO ONE OWNS MATURITY
When we published The Product Data Paradox, one number defined the field: of 405 industrial manufacturing and distribution organizations benchmarked, three reached Tier 4 of the Product Data Maturity Index. None reached Tier 5.
The question we heard most often afterward: which industries are furthest ahead? The answer is none of them — and all of them.
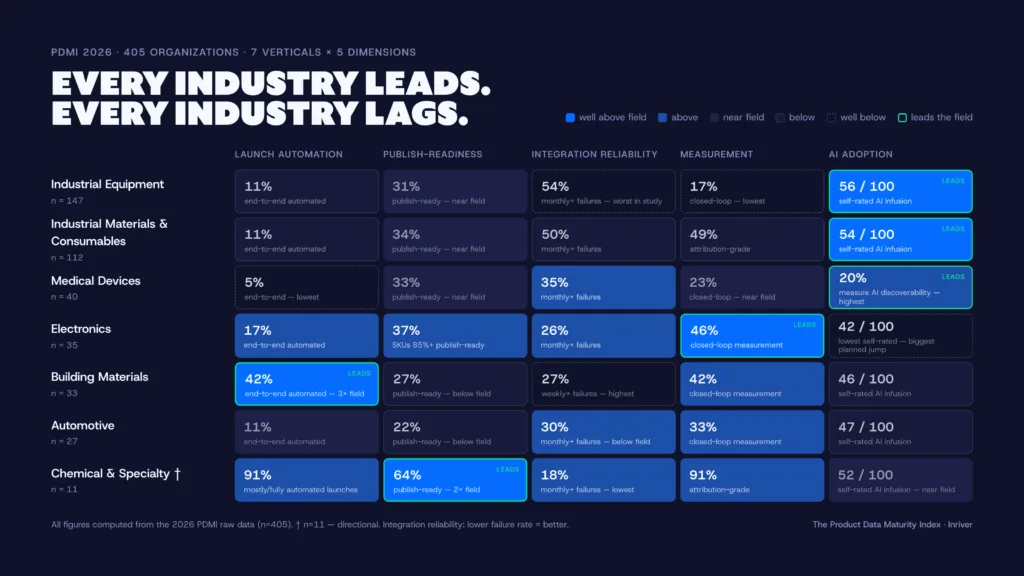
Sliced across the seven product verticals in the study, no industry led on more than one of the five operational dimensions we measured. Product data maturity is not a ladder some industries have climbed further than others. Each vertical has solved a different piece of the problem and left the rest unsolved.
Tier 4 requires every capability at a high standard at once: automated launches, publish-ready SKUs, reliable integrations, closed-loop measurement. Each of those capabilities is running at scale somewhere in the field — just never in the same place.
Every vertical leads in an area
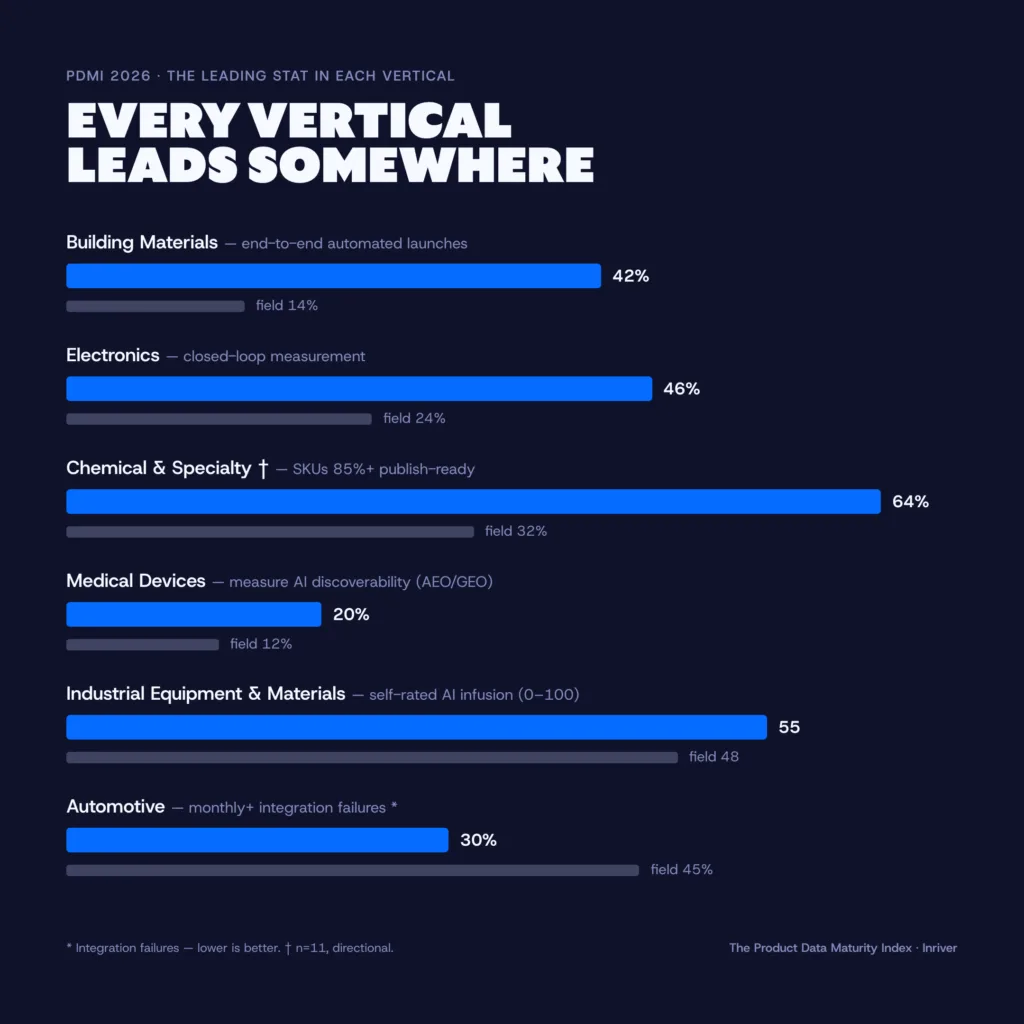
Building Materials leads on launch automation. Roughly 4 in 10 report end-to-end automated launches with an audit trail, nearly three times the 14% field rate.
Electronics leads on measurement. Just under half run closed-loop measurement tying product content to commercial outcomes, versus about a quarter of the field.
Chemical & Specialty leads on publish-readiness. Roughly 2 in 3 report 85%+ of active SKUs publish-ready at any moment, versus 1 in 3 field-wide. (Small base; directional.)
Medical Devices leads on AI-discoverability measurement. About 1 in 5 monitor how AI systems index and rank their product content, versus fewer than 12% field-wide — the highest rate in the study.
Industrial Equipment & Materials lead on AI adoption. The core industrial verticals rate themselves furthest along on building AI into product data workflows, the highest self-reported adoption in the field.
Automotive leads on integration reliability, with the lowest failure rate in the study: about 3 in 10 report monthly-or-more integration failures, versus 45% field-wide.
…and every vertical lags somewhere
The same slices, read from the other direction:
- The vertical that leads on launch automation reports weekly integration failures above the field rate, and publish-readiness below it. Automated pipes don’t guarantee ready SKUs.
- The verticals that lead on publish-readiness and on AI-discoverability measurement both make agentic-readiness claims that run well ahead of their automation levels.
- The verticals that lead on AI adoption report the most frequent integration failures in the study, and the lowest rates of attribution-grade measurement.
- The vertical that leads on measurement makes the fewest readiness claims in the field. The more an organization measures, the less it claims.
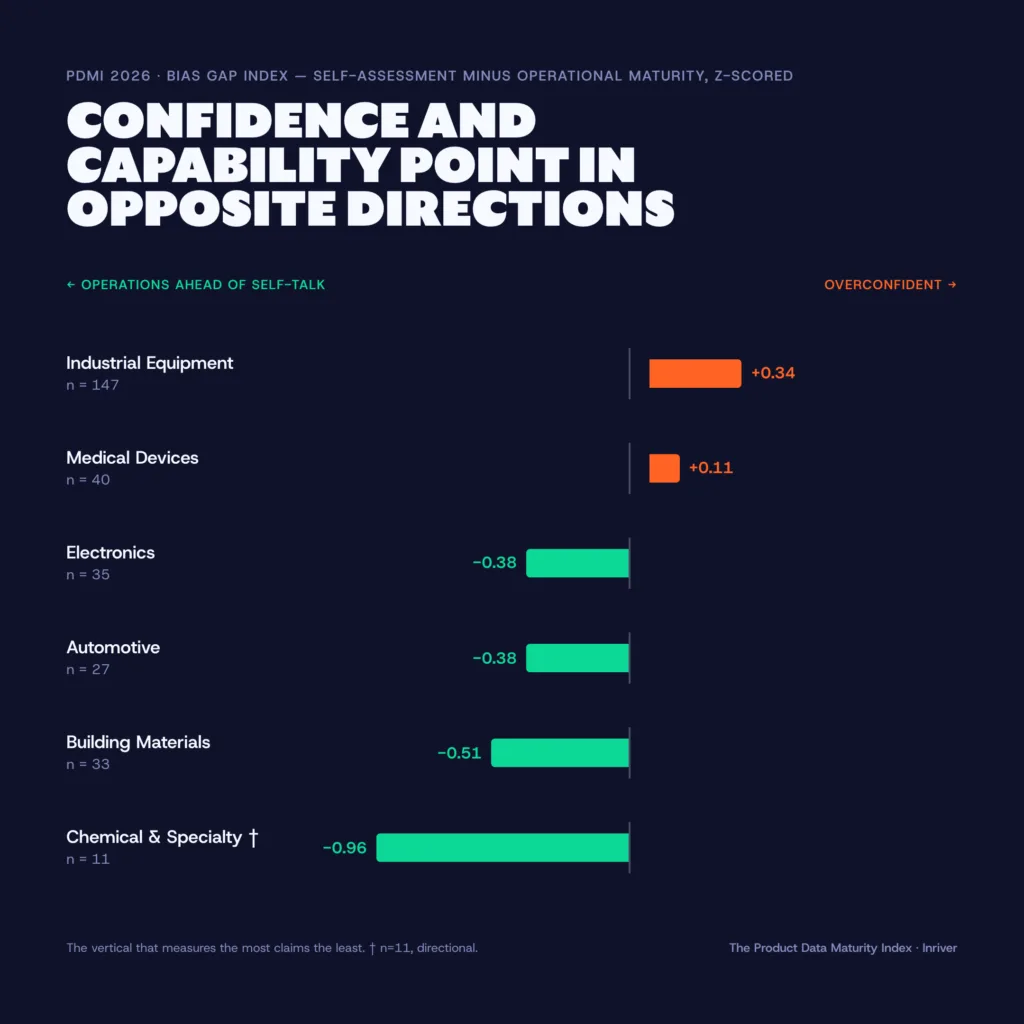
That last pattern holds across the entire benchmark: in some verticals, agentic-readiness claims run at twice the field rate while automation runs behind it; in others, claims run at a third of the field rate while operations run ahead of it.
Across the field, confidence and capability are uncorrelated. At the vertical level, they often point in opposite directions.
What this means if you run product data operations
The same slices, read from the other direction:
Your ceiling is proven
Whatever capability your organization struggles with most, some vertical with comparable SKU complexity, channel counts, and revenue bands is already running it at two to three times the field rate. The constraint isn’t the industry you’re in.
Your strength is not a strategy
Excelling on one dimension while deferring the rest produces what every vertical in this study shows: a functional operation with a hard ceiling. Tier 4 requires all five at once. Three organizations out of 405 got there.
The profile matters more than the score
Before asking “how mature are we,” ask “which of these profiles do we resemble”: strong automation with weak data quality, strong measurement with cautious claims, or strong confidence with untested infrastructure
Which profile looks like yours?
Three questions from the benchmark cut through self-assessment faster than any maturity model:
- What percentage of active SKUs are publish-ready right now? Not last quarter, not on average — right now.
- When did your most recent integration failure occur? If the answer is “we don’t track that,” the failures are still happening; they’re just not being measured.
- Which of your AI claims would survive a “show me production” meeting? The claims that survive are worth leading with. The ones that don’t are the roadmap.
Methodology: The Product Data Maturity Index draws on a 2026 survey of 405 senior technology, data, and marketing executives at industrial manufacturing and wholesale distribution organizations in the United States and Europe ($100M+ annual revenue). Vertical sample sizes: Industrial Equipment (147), Industrial Materials & Consumables (112), Medical Devices (40), Electronics (35), Building Materials (33), Automotive (27), Chemical & Specialty Products (11). Findings for verticals under n=50 are reported as rounded ranges; Chemical & Specialty findings are directional due to base size. Research by Silicon Valley Research Group. Published by Inriver.
Want to share this guide?
Download this guide as a PDF. Or download the full Product Data Paradox report to find out even more
Get the full Product Data Paradox report
AI commerce is here. Research shows, the more confident you are that you’re ready, the less likely it is that you are. Read the report to learn the 5 biggest AI commerce blindspots that organizations face and how you can close the gaps.






“Best-in-class SaaS solution for PIM.”
Verified G2 review by cosmetics brand
“The most flexible data modeling platform.”
Verified G2 review by medical manufacturer
“There are no limits to what [Inriver] can do.”
Verified G2 review by medical manufacturer
See the Inriver PIM in action
Inriver transforms the way your business thinks about product data. Let an Inriver expert explain the many benefits of the enterprise-ready, fully adaptable Inriver platform.
- Get a personalized, guided demo of the Inriver platform
- Have all your PIM questions answered
- Free consultation, zero commitment
Thanks for choosing Inriver! We’ll be in touch soon.
Please try again in a moment.